Options Education · Beginner
How to Read the Nifty Option Chain: A Beginner's Guide
The first time you open the Nifty option chain on NSE, it looks like a spreadsheet someone designed specifically to confuse you. Hundreds of rows, columns you have never heard of, numbers changing every few seconds. Most beginners close it and never come back. That is a mistake. The option chain is the single most useful tool available to a Nifty options trader. It tells you where the big money is sitting, which strikes matter, what the market expects, and how nervous or calm traders currently are. This guide walks through every column, one at a time, with plain explanations and real examples.
In This Article
- The Basic Structure: What You Are Looking At
- The Key Columns Explained, One by One
- Open Interest: Where the Big Money Is Sitting
- PCR: The Market's Mood in a Single Number
- Implied Volatility: How Scared the Market Is
- Max Pain: The Strike That Hurts Most Buyers
- Reading the Chain Before a Trade: A Step-by-Step Routine
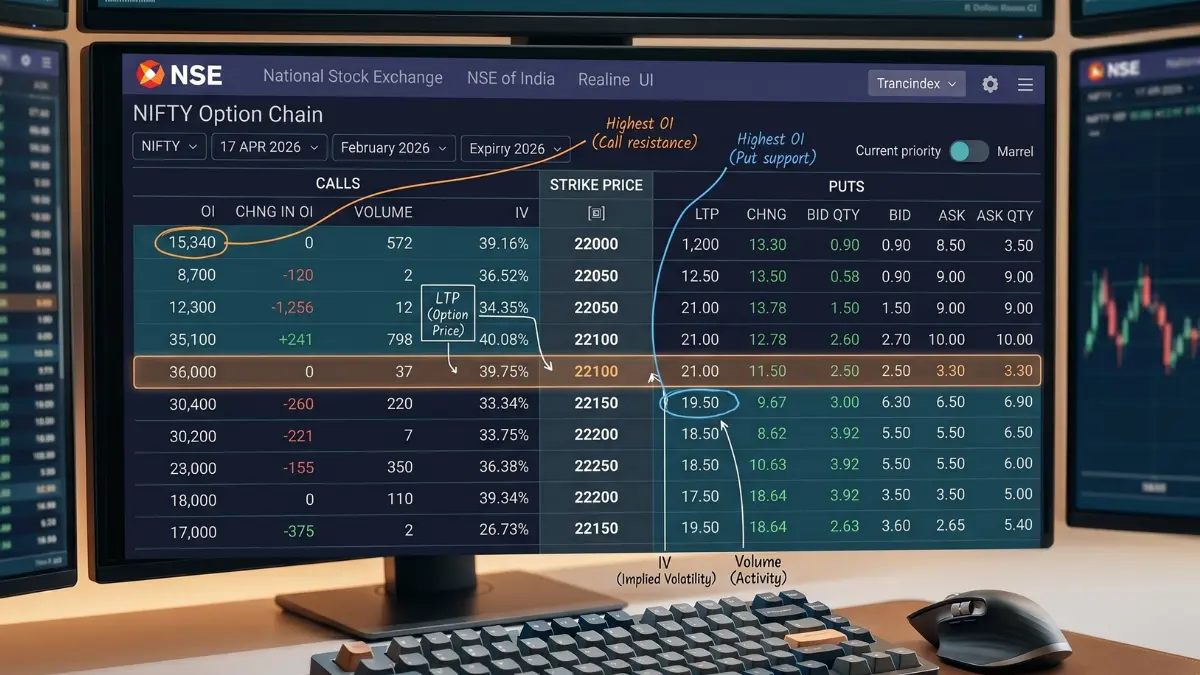
The Basic Structure: What You Are Looking At
Open the Nifty option chain on NSE's website at nseindia.com, go to Market Data, then Option Chain, and select Nifty. What you see is a table split down the middle by a column of strike prices.
Everything on the left side is data for Call options (CE). Everything on the right side is data for Put options (PE). The strike prices run down the centre, from lowest at the top to highest at the bottom.
The row highlighted in blue or yellow in the middle is the ATM strike (at the money), which is the strike price closest to where Nifty is currently trading. As of mid-March 2026, with Nifty around 23,200, the ATM strike would be the 23,200 row.
Strikes above the ATM row have calls that are in the money and puts that are out of the money. Strikes below have puts that are in the money and calls that are out of the money. Do not worry if that sounds confusing. It will become clear as we go through the columns.
The Key Columns Explained, One by One
Let's go through each column systematically. The NSE option chain shows the same set of columns for calls on the left and puts on the right, mirrored around the central strike price column.
| Column name | What it means | What to watch for |
|---|---|---|
| OI Open Interest |
Total number of outstanding option contracts at this strike that have not been settled or squared off. Each contract represents one lot of 65 units (Nifty lot size from Jan 2026). | High OI is often interpreted as support/resistance assuming positions are predominantly written (sold). However, without knowing whether positions are long or short, OI alone cannot confirm direction. |
| Chng in OI | How much the OI has changed since the previous close. A positive number means new positions were opened. A negative number means positions were closed or squared off. | Rising OI with falling option prices is often interpreted as writing activity, though this cannot be confirmed without additional data such as trade direction. |
| Volume | Total number of contracts traded today for this strike. Resets to zero each morning. | High volume confirms activity. High OI without volume means old, inactive positions. When volume spikes suddenly at a strike, institutions are likely entering or exiting there. |
| IV Implied Volatility |
The market's expectation of how much Nifty will move, expressed as an annualised percentage. Derived from the current option price using Black-Scholes. | Higher IV at a strike means that strike's option is more expensive relative to its distance from ATM. A rising IV across all strikes means India VIX is rising. IV tends to be highest at ATM strikes and lower as you move further OTM. |
| LTP Last Traded Price |
The last price at which this option contract was bought or sold. This is the option's current market price, what you will pay or receive for one lot. | Multiply LTP by the lot size (65) to get the total premium for one lot. A Nifty 23,200 CE with LTP of ₹180 costs ₹180 × 65 = ₹11,700 for one lot. |
| Net Chng | How much the LTP has changed from yesterday's closing price. Green = up, red = down. | Tells you whether this option has gained or lost value today. Useful for tracking positions you already hold. |
| Bid Qty / Bid Price | The highest price a buyer is currently willing to pay, and how many lots at that price. | The gap between bid and ask is called the spread. For ATM Nifty options, spreads are typically 50 paise to ₹1. For far OTM strikes, spreads can be ₹3 to ₹5 or more. Wide spreads mean poor liquidity and difficult exits. |
| Ask Qty / Ask Price | The lowest price a seller is currently willing to accept, and how many lots at that price. | When you buy an option, you pay the ask price. When you sell, you receive the bid price. Always place limit orders between bid and ask, not market orders, to avoid slippage. |
Open Interest: Where the Big Money Is Sitting
OI is the most widely discussed metric in the Nifty option chain and also the most misunderstood. Let me give you a clear, practical understanding.
Open interest is the total number of contracts that are currently open, meaning they have been entered into but not yet closed, exercised, or expired. Think of it as the count of "bets still on the table" at any given strike price.
Here is the core insight that makes OI useful: option sellers tend to write contracts at strikes they believe Nifty will not reach by expiry. That is where their profit lies. So strikes with very high OI, particularly on the call side above ATM and on the put side below ATM, represent strikes where a large number of sellers believe Nifty will stay away from.
How to identify support and resistance from OI
Look at the call side of the chain. Find the strike with the highest call OI above the current Nifty level. That strike is often a resistance zone. Sellers have positioned there expecting Nifty will not break above it by expiry. During normal (non-crisis) weeks, Nifty tends to struggle to sustain above that strike, especially in the final days before expiry.
Now look at the put side. Find the strike with the highest put OI below the current level. That is often a support zone where put sellers have positioned there expecting Nifty will not fall below it. A practical example: if the 23,000 PE has 2 lakh contracts outstanding and the 23,500 CE has 1.8 lakh contracts, the market is broadly suggesting a 23,000 to 23,500 range for that expiry.
OI buildup vs OI unwinding
Fresh call OI building up at 23,500 CE while Nifty is at 23,200 means writers are entering new short positions there, reinforcing resistance. Call OI falling at 23,500 means those sellers are covering and exiting, which sometimes happens when Nifty breaks above a level and sellers decide to cut losses. OI unwinding at a resistance level can actually be bullish, because the resistance is being removed. Watching change in OI is more informative than looking at the absolute number.
Practice Reading OI in a Real Nifty Scenario. For Free.
NiftyWise's simulator shows you live open interest data as you trade through historical Nifty scenarios. See how OI builds and unwinds during Budget Day, expiry day, and market shocks.
Launch Free Simulator →PCR: The Market's Mood in a Single Number
PCR stands for Put-Call Ratio. It is one of the most widely tracked sentiment indicators in Indian options trading, and it takes about five seconds to read once you understand what it means.
The formula is simple: PCR = Total Put OI / Total Call OI.
If there are 1.5 lakh put contracts and 1 lakh call contracts outstanding across all strikes, the PCR is 1.5.
What different PCR readings mean
An important nuance about PCR: it is a contrarian indicator more than a directional one. Very high PCR does not mean the market will fall. It often means too many people are already positioned for a fall, making a rally more likely as those positions get squeezed. Very low PCR does not mean the market will rise. It can signal complacency ahead of a correction.
"PCR tells you what the crowd is betting on. In markets, when the crowd bets too hard in one direction, the market has a habit of punishing them. PCR above 1.6 is not a green light to buy. It is a yellow light saying the bears may be overcrowded."
How to use PCR practically
Check PCR at market open, around 9:15 to 9:30 AM. Compare it to the previous day's closing PCR. A sudden PCR spike overnight, say from 1.0 to 1.4, suggests fear entered the market after hours. A gap down opening is likely. A PCR drop overnight suggests optimism and a gap up is possible. During intraday trading, track it every 30 minutes. A PCR moving sharply in one direction often precedes a corresponding move in Nifty.
Implied Volatility: How Scared the Market Is
The IV column in the option chain shows the implied volatility for each individual strike. You will notice something interesting when you look at it: IV is not the same across all strikes. It forms a shape called the volatility smile or volatility skew.
In the Nifty option chain, IV is typically higher for put options (especially OTM puts) than for equivalent call options. This is because traders in India, like everywhere else, pay extra for downside protection. Institutional investors buy OTM puts to hedge portfolios. That extra demand for OTM puts keeps their IV elevated relative to calls at the same distance from ATM.
What IV tells you column by column
When you scan down the IV column, a sudden spike in IV at a specific strike relative to surrounding strikes can signal that large traders are actively pricing in a big move to or from that level. During normal weeks, IV tends to be highest at ATM and gradually decreases as strikes move away from current price. Any distortion in this pattern is worth investigating.
IV and the current environment
In mid-March 2026, with India VIX around 22, all strikes on the Nifty chain have elevated IV compared to January when VIX was below 9. A 23,200 ATM call that had IV of 9% in January might now show IV of 22%. The option costs roughly 2.4 times more. This is why checking India VIX before reading the option chain matters. A high VIX means every number you read in the IV column is in an inflated state. Once VIX normalises, those IVs will compress and premiums will fall.
Max Pain: The Strike That Hurts Most Buyers at Expiry
Max Pain is a concept that generates significant debate in Indian trading communities. Let me give you the factual version, including its limitations, rather than overselling it.
Max Pain is the strike price at which the largest number of option contracts (both calls and puts) would expire worthless, resulting in the maximum total loss for option buyers and minimum payout for option sellers. Every expiry, there is one such strike. It is calculated by adding up the total in-the-money value that sellers would need to pay out at each strike, and finding the strike where that total is lowest.
Why it matters, and why it is not magic
The theory behind Max Pain is that as expiry approaches, market makers and large institutional sellers tend to hedge their books in ways that naturally pull price toward Max Pain. This is not manipulation in the illegal sense. It is the mechanical result of delta hedging by large participants who benefit when options expire worthless.
Studies on liquid markets like Nifty 50 suggest Max Pain aligns with the actual expiry price roughly 60 to 70% of the time in calm, range-bound conditions. That is meaningful but not reliable enough to trade on alone.
It fails in high-volatility environments. When a major event drives Nifty sharply in one direction, Max Pain becomes irrelevant. The 685-point fall on 4 March 2026 had nothing to do with where Max Pain was sitting that week. The market moved on fundamental news, not on option chain mechanics.
How to use Max Pain practically
In expiry week, specifically Monday and Tuesday for weekly Nifty (expiry is every Tuesday from September 2025), check where Max Pain is. If Nifty is trading significantly above or below Max Pain, there may be gravitational pull toward it in the final hours of Tuesday's session. This is useful context for setting targets or stops on short-term positions, especially if no major macro event is scheduled for that day.
Use it as one input. Not as a standalone signal. Never trade against a strong fundamental trend just because Max Pain says otherwise.
Reading the Option Chain Before a Trade: A Step-by-Step Routine
Here is a practical morning routine for reading the Nifty option chain before placing any trade. This takes about 5 minutes and gives you a complete picture of the current market structure.
🎯 How to read the Nifty option chain: the short version
- The option chain is a table split into calls (left) and puts (right), with strike prices down the centre. The highlighted ATM row is the closest strike to Nifty's current level.
- OI (Open Interest) shows where contracts are sitting. High call OI above ATM = resistance. High put OI below ATM = support. These are the most actionable levels on the chain.
- Change in OI matters more than absolute OI. Rising OI means new positions are entering. Falling OI means positions are closing. Fresh call writing at a strike reinforces resistance. OI unwinding at a level removes it.
- PCR = Total Put OI / Total Call OI. Below 0.7 means crowded bulls, often contrarian bearish. Above 1.6 means crowded bears, often contrarian bullish. Between 0.7 and 1.3 is neutral.
- IV in each row tells you how expensive that specific option is. Higher IV = more expensive premium relative to the strike's distance from ATM. Rising IV across the board tracks with a rising India VIX.
- Max Pain is the strike where total option buyers lose the most at expiry. It aligns with actual expiry price roughly 60 to 70% of the time in calm markets. Ignore it when there is a strong macro event driving Nifty.
- Nifty expiry is every Tuesday from September 2025. Lot size is 65 from January 2026. All premium calculations multiply LTP by 65.
- Check VIX first, then OI levels, then PCR, then change in OI at your specific strike, then the bid-ask spread. That five-minute routine gives you all the context you need before entering a trade. (The following framework is for educational understanding of how traders may interpret option chain data and should not be construed as a trading strategy or recommendation.)
Frequently Asked Questions
Where can I access the Nifty option chain for free?
NSE India's official website at nseindia.com provides the full Nifty option chain free of charge, updated approximately every 3 seconds during market hours from 9:15 AM to 3:30 PM IST. No login or account is required. Navigate to Market Data, then Option Chain, and select NIFTY from the symbol dropdown. All major brokers, including Zerodha, Upstox, Angel One, and 5paisa, also display the option chain within their trading platforms, often with additional features like OI charts and PCR calculators.
What is the difference between OI and Volume in the option chain?
OI (Open Interest) is the total number of contracts that are currently open and outstanding across all traders. It accumulates over time and resets only when positions are closed or expire. Volume is the number of contracts traded on that specific day. It resets to zero every morning. A strike can have very high OI from previous days' activity but very low volume today, meaning it is a relevant level but not currently active. When both OI and volume are high at a strike, it signals active interest and fresh positioning at that level.
What is a good PCR level to buy Nifty calls?
PCR is a contrarian indicator, not a directional one. A PCR above 1.6 (extreme put loading) has historically been associated with Nifty bounces because bearish positions get overcrowded. A PCR below 0.7 (extreme call buying) has been associated with corrections for the same reason. However, PCR alone is not a trading signal. Always confirm with price action, support levels, and the overall macro environment. In highly volatile periods like March 2026, PCR can stay elevated for extended periods without triggering the expected bounce.
How is Max Pain different from the highest OI strike?
They are different calculations. The highest OI strike on the call side is simply where the most call contracts are sitting. The highest OI strike on the put side is where the most put contracts are sitting. Max Pain is a separate calculation that finds the strike where the total value that sellers would need to pay out to buyers is minimised across all strikes simultaneously. Max Pain considers both sides together. High OI identifies individual important levels. Both are useful, but they are answering different questions.
Why do some strikes show very low volume and wide spreads?
Far out-of-the-money strikes have very little active trading because few participants expect Nifty to reach those levels by expiry. With fewer buyers and sellers, market makers widen the bid-ask spread to compensate for the risk of holding positions in illiquid contracts. For Nifty options, liquidity is concentrated in ATM and one to two strikes either side. Once you go three or more strikes OTM, spreads widen significantly and exits can be costly. Stick to the most liquid strikes, particularly ATM and slightly OTM, especially when starting out.
Practice Reading the Option Chain Through Real Nifty Scenarios
NiftyWise's free simulator shows you live OI, IV, and Greeks as you trade through historical Budget Day, expiry day, and market shock scenarios. ₹10 lakh virtual capital. No real money needed.
Launch Free Simulator →⚠️ Disclaimer: Please Read. This article represents the opinions and analysis of Devesh Bansal and the NiftyWise editorial team. The reviewer has no financial interest in the platform mentioned. Reviewed from a financial literacy and compliance perspective .No endorsement of any platform is intended. It is for educational purposes only and does not constitute investment advice, a trading recommendation, or financial guidance of any kind. All PCR thresholds, OI interpretations, and Max Pain accuracy figures cited are general guidelines based on publicly available market research and historical observation, not guarantees of future price behaviour. Nifty lot size of 65 is based on NSE circular effective January 2026. Nifty weekly expiry on Tuesday is effective from September 2, 2025, per NSE restructuring. Market conditions referenced, including India VIX levels and Nifty range, are as of mid-March 2026 and may have changed. NiftyWise is not registered with SEBI as an Investment Adviser, Research Analyst, or Stockbroker. Past performance, simulated or actual, is not indicative of future results. Options trading carries substantial risk of loss. As per SEBI's updated study (September 2024): 93% of individual traders in the equity F&O segment incurred losses between FY22 and FY24. Please consult a SEBI-registered Investment Adviser before making any investment decisions. Visit sebi.gov.in for a list of registered advisers.